
A room-pressure monitor shows +18 Pa. The door opens and the number drops to -1 Pa. A few seconds after the door closes, it settles at +17 Pa. Should the monitor alarm? Those three numbers alone cannot answer the question. The pressure reference, duration of the event, recovery behavior, and measurement uncertainty all matter.
A MEMS differential pressure sensor for cleanroom monitoring measures the difference between two sampling points. This guide explains how to turn that component measurement into useful OEM room-monitoring data, with RP3112D as a practical integration example. The pressures in the opening example are illustrative, not recommended setpoints.
Cleanroom Pressure Monitoring Is a Two-Point Measurement
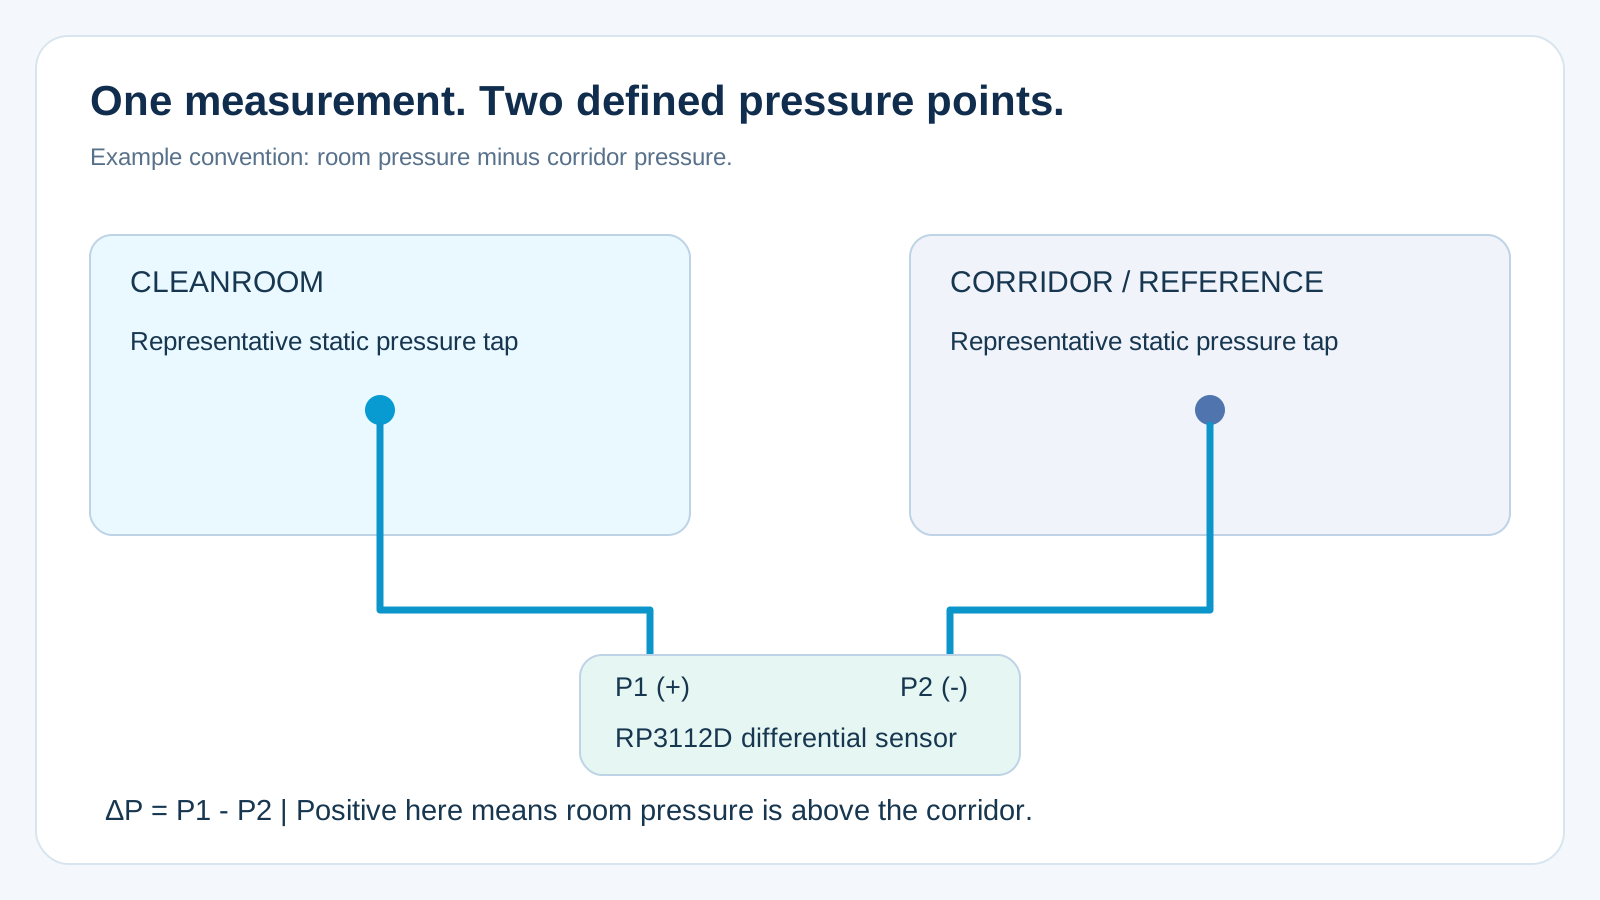
The number on the display is a pressure difference, not an isolated room pressure. One port may connect to the cleanroom and the other to a corridor or airlock. With the convention ΔP = P1 - P2, connecting P1 to the room makes a positive reading mean that the room is above its reference space. Confirm the physical port identification against the package drawing.
Mark the two spaces and pressure taps on the tubing drawing. Use the same labels on the fittings and in firmware. Reversed tubes can produce a believable number with the wrong meaning. The intended direction of the pressure cascade depends on the facility design; this example does not prescribe positive pressure for every controlled space.
The distinction between monitoring and control also matters. The sensor reports the result of fans, dampers, leakage, and door use. It does not correct the room by itself. Slow recovery may point to the air system or room envelope as well as to the measurement path.
A Pressure Trace Is More Useful Than a Setpoint Alone
Before choosing a range, record ordinary door cycles and relevant fan startup or shutdown events. Identify the closed-door band, excursions, reversals, and recovery time. Separate the pressures that must be measured accurately from exceptional events that only need to remain within the component's permitted pressure limits.
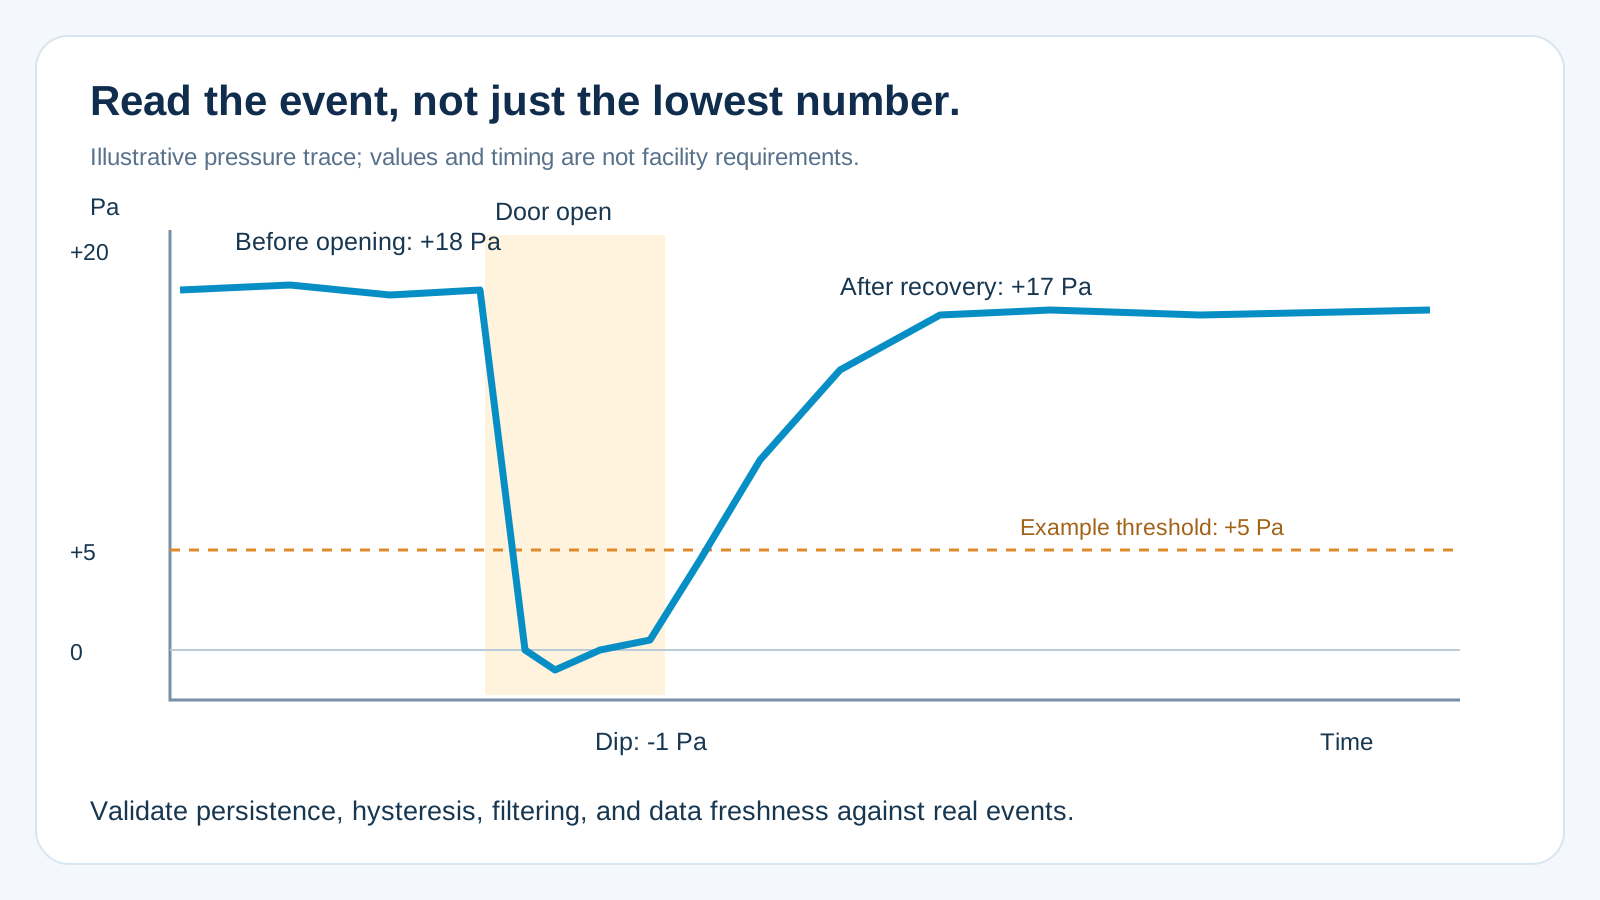
The controller should evaluate pressure magnitude and duration together. Filtering can steady the display, but it adds delay. Alarm persistence, hysteresis, door status where available, and sensor-data freshness should be tested using actual room events. Do not choose a delay merely to suppress inconvenient alarms.
Choose Range From the Error Budget Near the Alarm Point
A wider range provides calibrated measurement headroom, but it may allocate more pressure-equivalent error to the small region around zero. Within the standard RP3112D options, the ±500 Pa version is the first candidate to evaluate for low room differentials. Move to ±1 kPa or above when the required accurately measured pressure envelope justifies it. Neither range is automatically suitable for a particular alarm tolerance.
Convert %FS to pascals before comparing parts
RP3112D Datasheet V1.0 lists ±1% FS accuracy at 25°C, defined as non-linearity, hysteresis, and repeatability under reference conditions. It separately lists ±2.5% FS total error, including zero offset, span error, and temperature drift. These are different specifications; the accuracy figure alone is not an installed monitor's absolute error.
For RP3112D, full scale (FS) means the complete pressure span: maximum pressure minus minimum pressure. The ±500 Pa version therefore has a 1,000 Pa span, not a 500 Pa span. Convert each percentage using this full span before comparing it with an alarm-point error requirement.
- ±500 Pa range: FS = 500 - (-500) = 1,000 Pa. The stated ±1% FS accuracy corresponds to ±10 Pa at 25°C; ±2.5% FS total error corresponds to ±25 Pa under the applicable specification conditions.
- ±1 kPa range: FS = 1,000 - (-1,000) = 2,000 Pa. The stated ±1% FS accuracy corresponds to ±20 Pa at 25°C; ±2.5% FS total error corresponds to ±50 Pa under the applicable specification conditions.
This calculation matters for the opening example: a nominal room differential of +18 Pa does not by itself establish that the sensor can support a tight absolute alarm tolerance. If a project requires, for example, ±2 Pa installed accuracy, the standard ±500 Pa specification does not establish compliance. Review the required performance with Reliava before selecting a sensor or calibration. Fine digital output steps and a stable display do not remove this error budget.
Distinguish the operating temperature range from the compensated measurement range. The datasheet lists -20 to 100°C operation and 0 to 60°C compensation. Review total error under the temperature conditions relevant to the monitor. Allow for installed zero shift, long-term drift, reference uncertainty, and tubing effects without double-counting errors already included in the sensor specification.
The 24-bit pressure data format does not establish 24-bit measurement accuracy or effective resolution. Verify output noise, stable detectable pressure changes, and repeatability around the real alarm threshold. If the required error is smaller than the verified capability, review a different calibration or sensor specification.
Read the MEMS pressure sensor accuracy guide
The Tubes and Pressure Taps Are Part of the Instrument
A leak, pinched tube, restricted wall fitting, or liquid trapped in a low section can change the pressure reaching the ports. These faults may not produce an I²C error. The digital interface can work correctly while the pneumatic measurement is wrong.
Different tube lengths, internal diameters, or restrictions can give the two sides different dynamic responses. This can distort a transient; unequal length alone does not necessarily create a static error once both sides have settled. Keep routes practical, avoid concealed pinch points, and provide access for leak and blockage checks.
Place static pressure taps away from supply jets, return grilles, and door-gap air movement, at locations representative of the two spaces. RP3112D is specified for dry, non-corrosive gas or air. Condensation, cleaning residue, and liquid exposure require an appropriate pressure-path design and material review. Filters or barriers also need testing because they can add restriction and delay.
Where RP3112D Fits in an OEM Cleanroom Monitor
RP3112D combines a MEMS piezoresistive element with a signal-conditioning ASIC. It delivers factory-calibrated, linearized, temperature-compensated digital pressure data through I²C. The OEM integrates the sensor into a monitor with its own enclosure, tubing, display, alarm logic, and building-system interface.
- Range options: RP3112D-C101 ±0.5 kPa; C102 ±1 kPa; C103 ±2.5 kPa; C105 ±10 kPa; C107 ±20 kPa.
- Supply voltage: 3.0-5.5 V continuous operating range, supporting both 3.3 V and 5 V systems. Ensure the I²C pull-up voltage is compatible with the host controller's input ratings; use level translation where required.
- Interface and package: I²C clock up to 400 kHz; SOIC-16 package with two vertical pressure ports. Use the current mechanical drawing for PCB and tubing design.
- Sensor conditioning: factory calibration and temperature compensation are already included. The finished assembly still needs verification for mounting stress, zero shift, pressure-path response, and alarm performance.
View the RP3112D product and request the current datasheet
I²C Integration: Keep Data Conversion and Timing Separate
The communication application note recommends external pull-ups, typically 4.7 kΩ, and a 0.1 µF decoupling capacitor close to VDD and VSS. Select pull-ups for the actual bus loading and logic levels. Leave NC pins unconnected. The sensor belongs near the local host electronics; BACnet, Modbus, or an industrial output is provided by the monitor's controller and interface hardware.
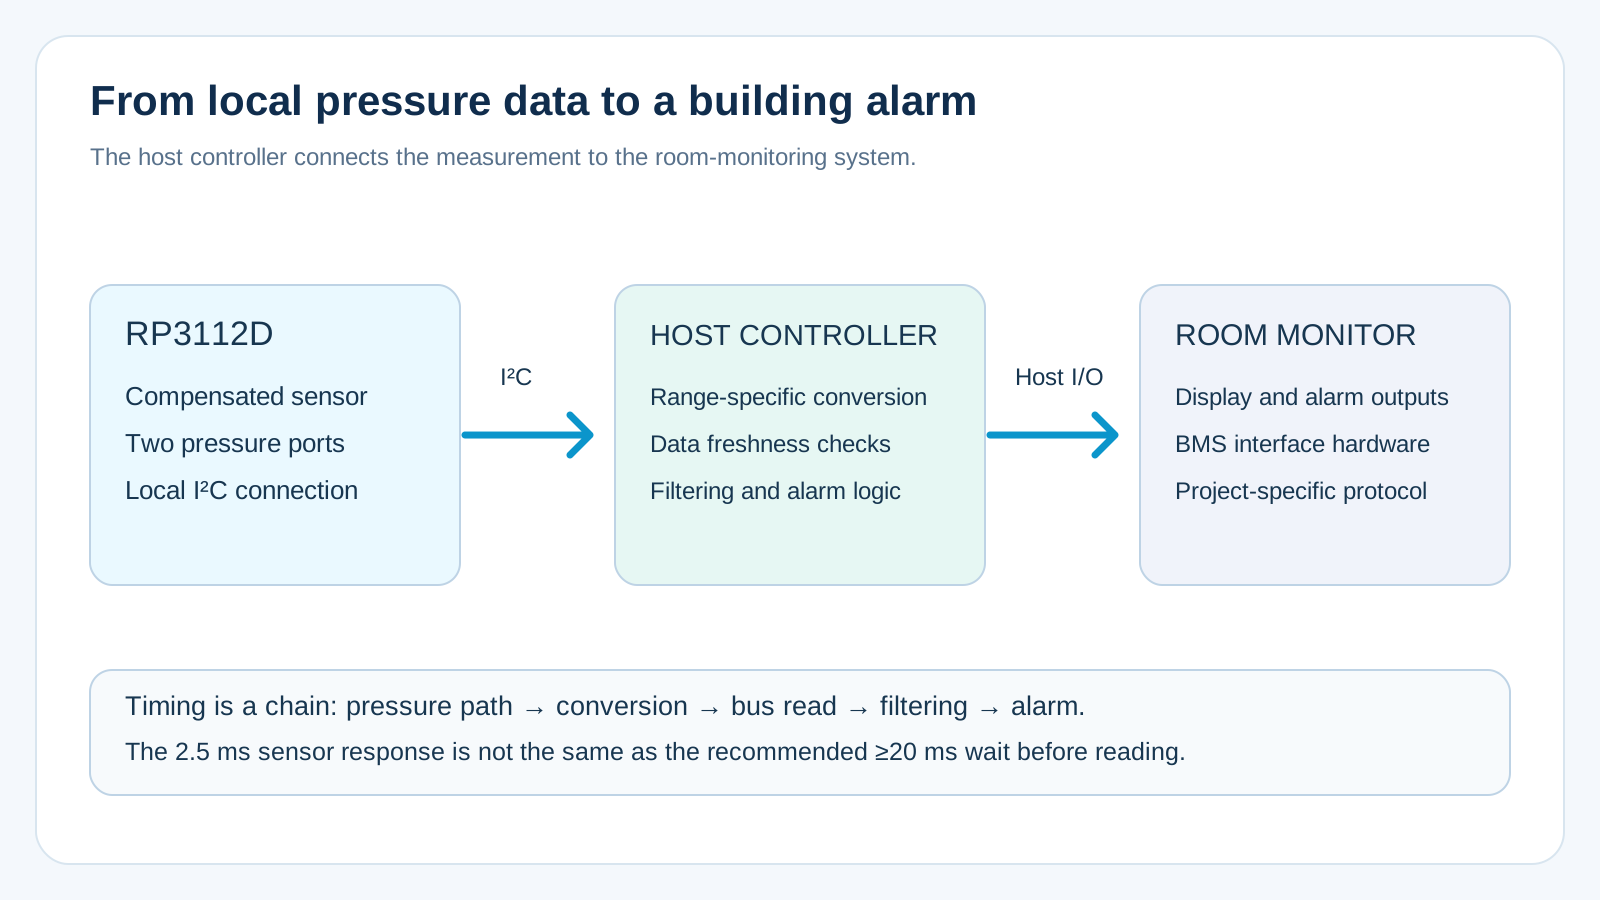
For the documented single-conversion sequence, the host writes 0x0A to command register 0x30. The application note recommends waiting at least 20 ms before reading pressure registers 0x06 to 0x08 and temperature registers 0x09 to 0x0A. This recommended delay is distinct from the datasheet's 2.5 ms response time, defined as the 10%-to-90% response to a pressure step. Bus speed, conversion scheduling, filtering, and tubing all contribute to end-to-end latency.
Pressure conversion uses the application note's range-dependent A and B coefficients and produces kPa; multiply by 1,000 for Pa. Verify the decoder and coefficient set against known negative, zero, and positive pressures for the exact order code. Raw-code sign alone does not determine physical pressure polarity when the transfer function includes an offset. Use the current range-specific integration guidance for implementation.
Check every transaction and distinguish valid fresh pressure from missing or stale data. A communication failure should not leave the last good pressure value looking like a current healthy reading. Likewise, a stable number alone cannot prove that both tubes are open; pneumatic fault detection may require additional checks or information.
Test the Prototype as a Complete Monitor
- Static verification: apply known positive, zero, and negative differential pressures. Verify port polarity, units, conversion, zero behavior, and error near each alarm threshold.
- Assembly verification: repeat the checks with the final PCB mounting, enclosure, fittings, filters, and representative tubing. Inspect tube load and PCB stress.
- Dynamic verification: reproduce a slow pressure loss, short door-style dip, and recovery. Measure the combined pressure-path, sampling, filtering, and alarm delay.
- Fault verification: restrict or disconnect a line and interrupt communication or supply. Evaluate which faults can be distinguished and how uncertain or stale measurements are reported.
Frequently Asked Questions
Is ±500 Pa automatically accurate enough for a cleanroom?
No. Its full span is 1,000 Pa, so ±1% FS corresponds to ±10 Pa at 25°C and ±2.5% FS corresponds to ±25 Pa under the applicable total-error conditions. Compare these specifications, temperature conditions, drift, and installed effects with the required alarm tolerance. A narrow range within the product family is not automatically sufficient for a few-pascal accuracy requirement.
Does factory calibration remove the need for an installed zero check?
No. Factory calibration addresses the sensor. Mounting stress and the assembled pressure path can change the installed result. Perform the checks required by the monitor design; do not automatically zero a real room-to-corridor pressure difference away.
Can RP3112D connect directly to a building management system?
The sensor provides a local I²C interface. A host controller and appropriate interface hardware implement the building protocol or electrical output required by the project.
Can RP3112D operate from both 3.3 V and 5 V supplies?
Yes. RP3112D supports a continuous 3.0-5.5 V supply range. Both 3.3 V and 5 V systems are supported. Check the SDA and SCL pull-up voltage against the MCU's input ratings, especially when the sensor and controller use different supply rails.
Can the pressure sensor determine cleanroom classification?
A differential pressure reading is one monitoring input. It does not establish particle cleanliness classification or demonstrate the performance of the whole controlled environment.
Start With a One-Page Measurement Brief
Draw the two spaces, label P1 and P2, and state which direction should read positive. Add the normal band, alarm thresholds, allowable error, accurately measured excursions, and a representative door-cycle trace. Include temperature, tube lengths, medium, supply voltage, host logic levels, and building communication requirements.
With this information, Reliava can help review the RP3112D range and integration approach against the actual monitor requirements. The useful selection is the one supported by the pressure profile and error budget.
Discuss a cleanroom pressure-monitoring design
Technical references: RP3112D MEMS Differential Pressure Sensor Datasheet V1.0 and RP3112D I²C Communication Application Note V1.0, with Reliava's confirmed 3.0-5.5 V continuous supply range and full-span FS definition. Contact our team for the current range-specific documentation.